Mental Health of the World Dashboard

In the above visualizations, I developed an interactive Tableau dashboard analyzing global mental health trends using a dataset sourced from Kaggle. I designed multiple dynamic visualizations to explore prevalence by geography and trends over time.
The tools used in this project included MySQL for querying and structuring the dataset, Excel for initial data cleaning and exploratory analysis, and Tableau for dashboard development and interactive design.
One key insight observed was that when anxiety or depression were selected from the dropdown filter, countries experiencing economic hardship showed significantly higher heat index intensity compared to disorders such as schizophrenia, eating disorders, and bipolar disorder. This suggests potential correlations between economic conditions and certain categories of mental health prevalence.
Heart Disease ML Identifier
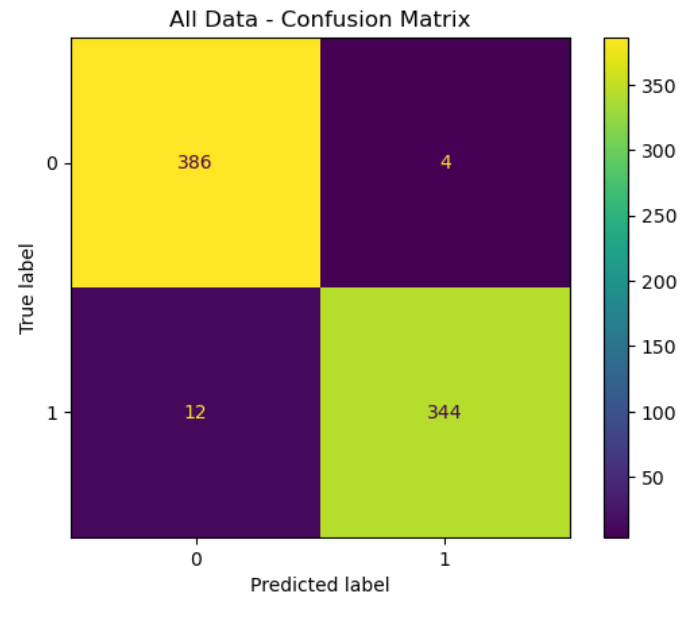
In the above visualizations, I developed a machine learning model to predict the likelihood of heart disease using a clinical dataset sourced from Kaggle. The dataset consisted of raw patient health metrics including cholesterol levels, resting blood pressure, maximum heart rate, age, and confirmed heart disease diagnosis.
The tools used in this project included Python for development, Pandas for data cleaning and preprocessing, Scikit-Learn for building the Random Forest classification model, and Matplotlib for visualizations. After preparing the dataset, I trained the model to classify whether a patient was likely to have heart disease based on the provided clinical indicators.
To evaluate performance, I generated a confusion matrix to analyze true positives, true negatives, false positives, and false negatives. This allowed me to better understand how well the model identified high-risk patients versus incorrectly classified cases.
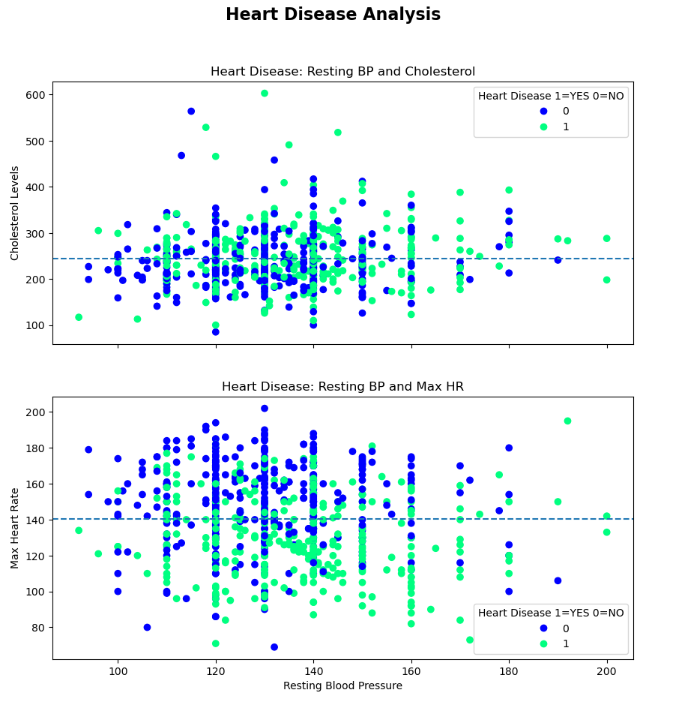
In addition to model evaluation, I created scatter plots comparing resting blood pressure vs. cholesterol and resting blood pressure vs. maximum heart rate. From these visualizations, there is a noticeable pattern showing that individuals with higher resting blood pressure and lower maximum heart rate tend to appear more frequently in confirmed heart disease cases. The relationship is visually distinct and reinforces the predictive value of those variables within the model.
Fisherman's Journey – Mobile Application (In Progress)
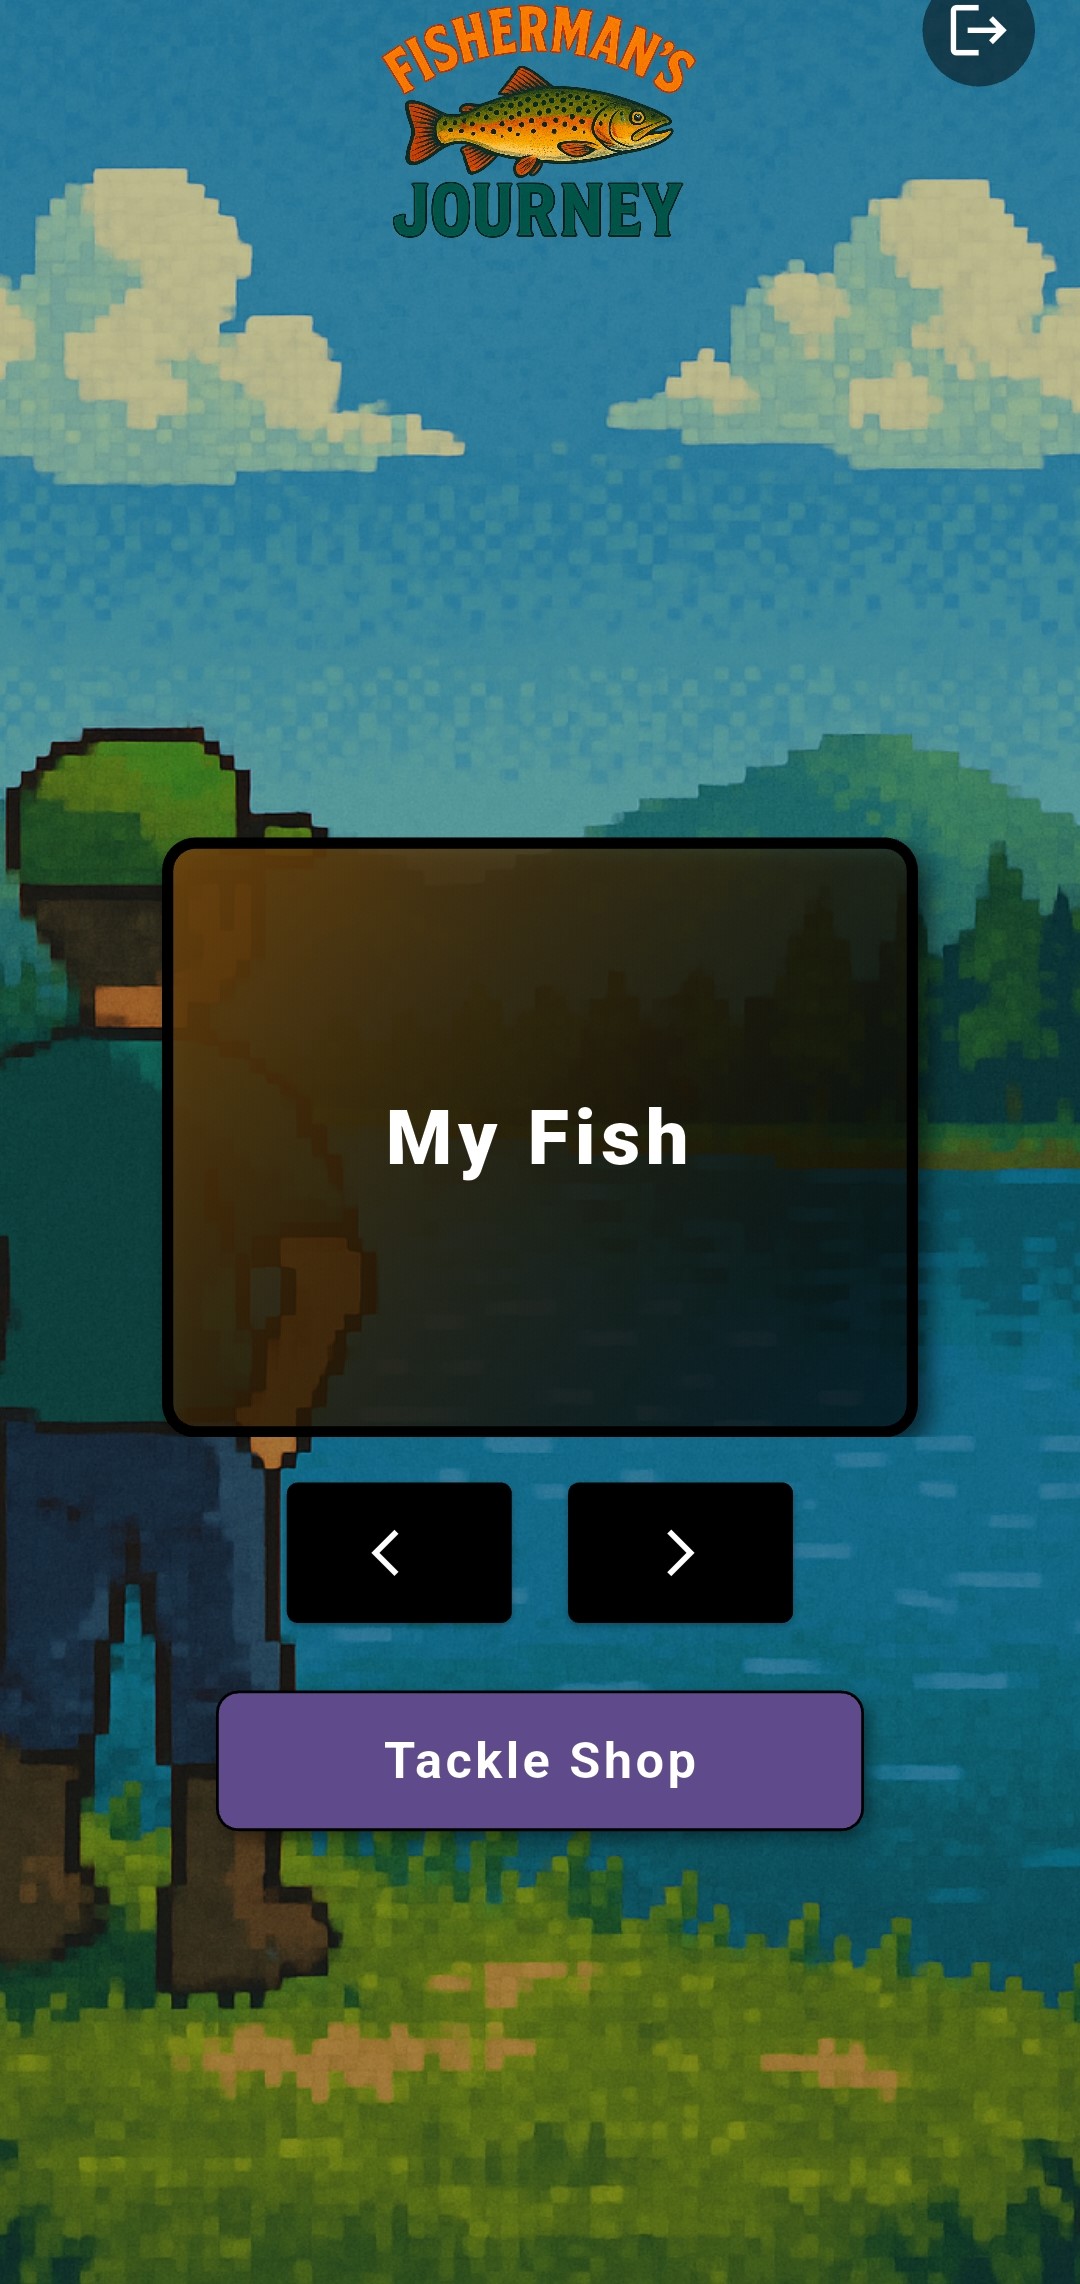
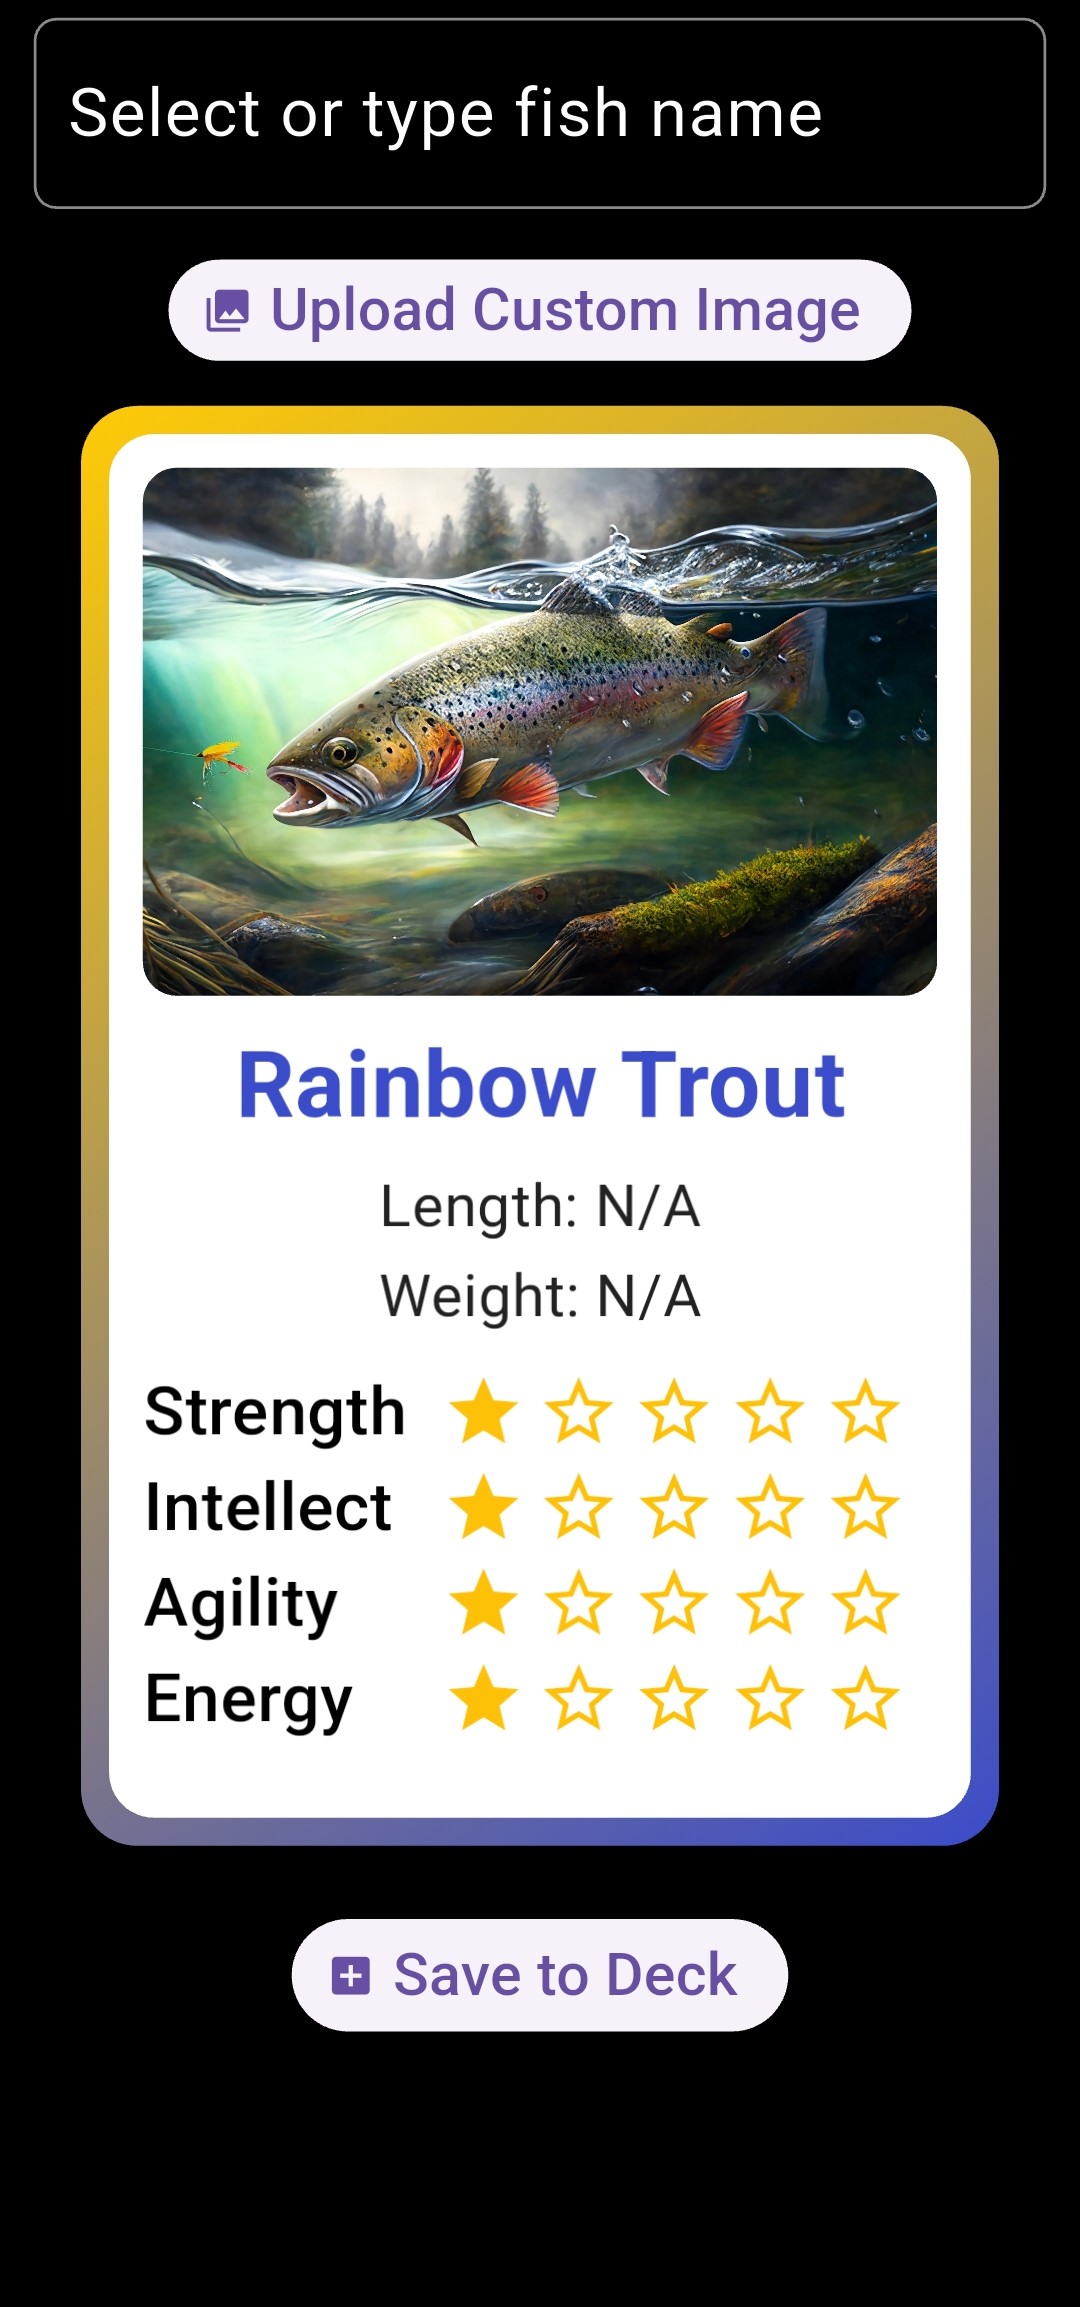
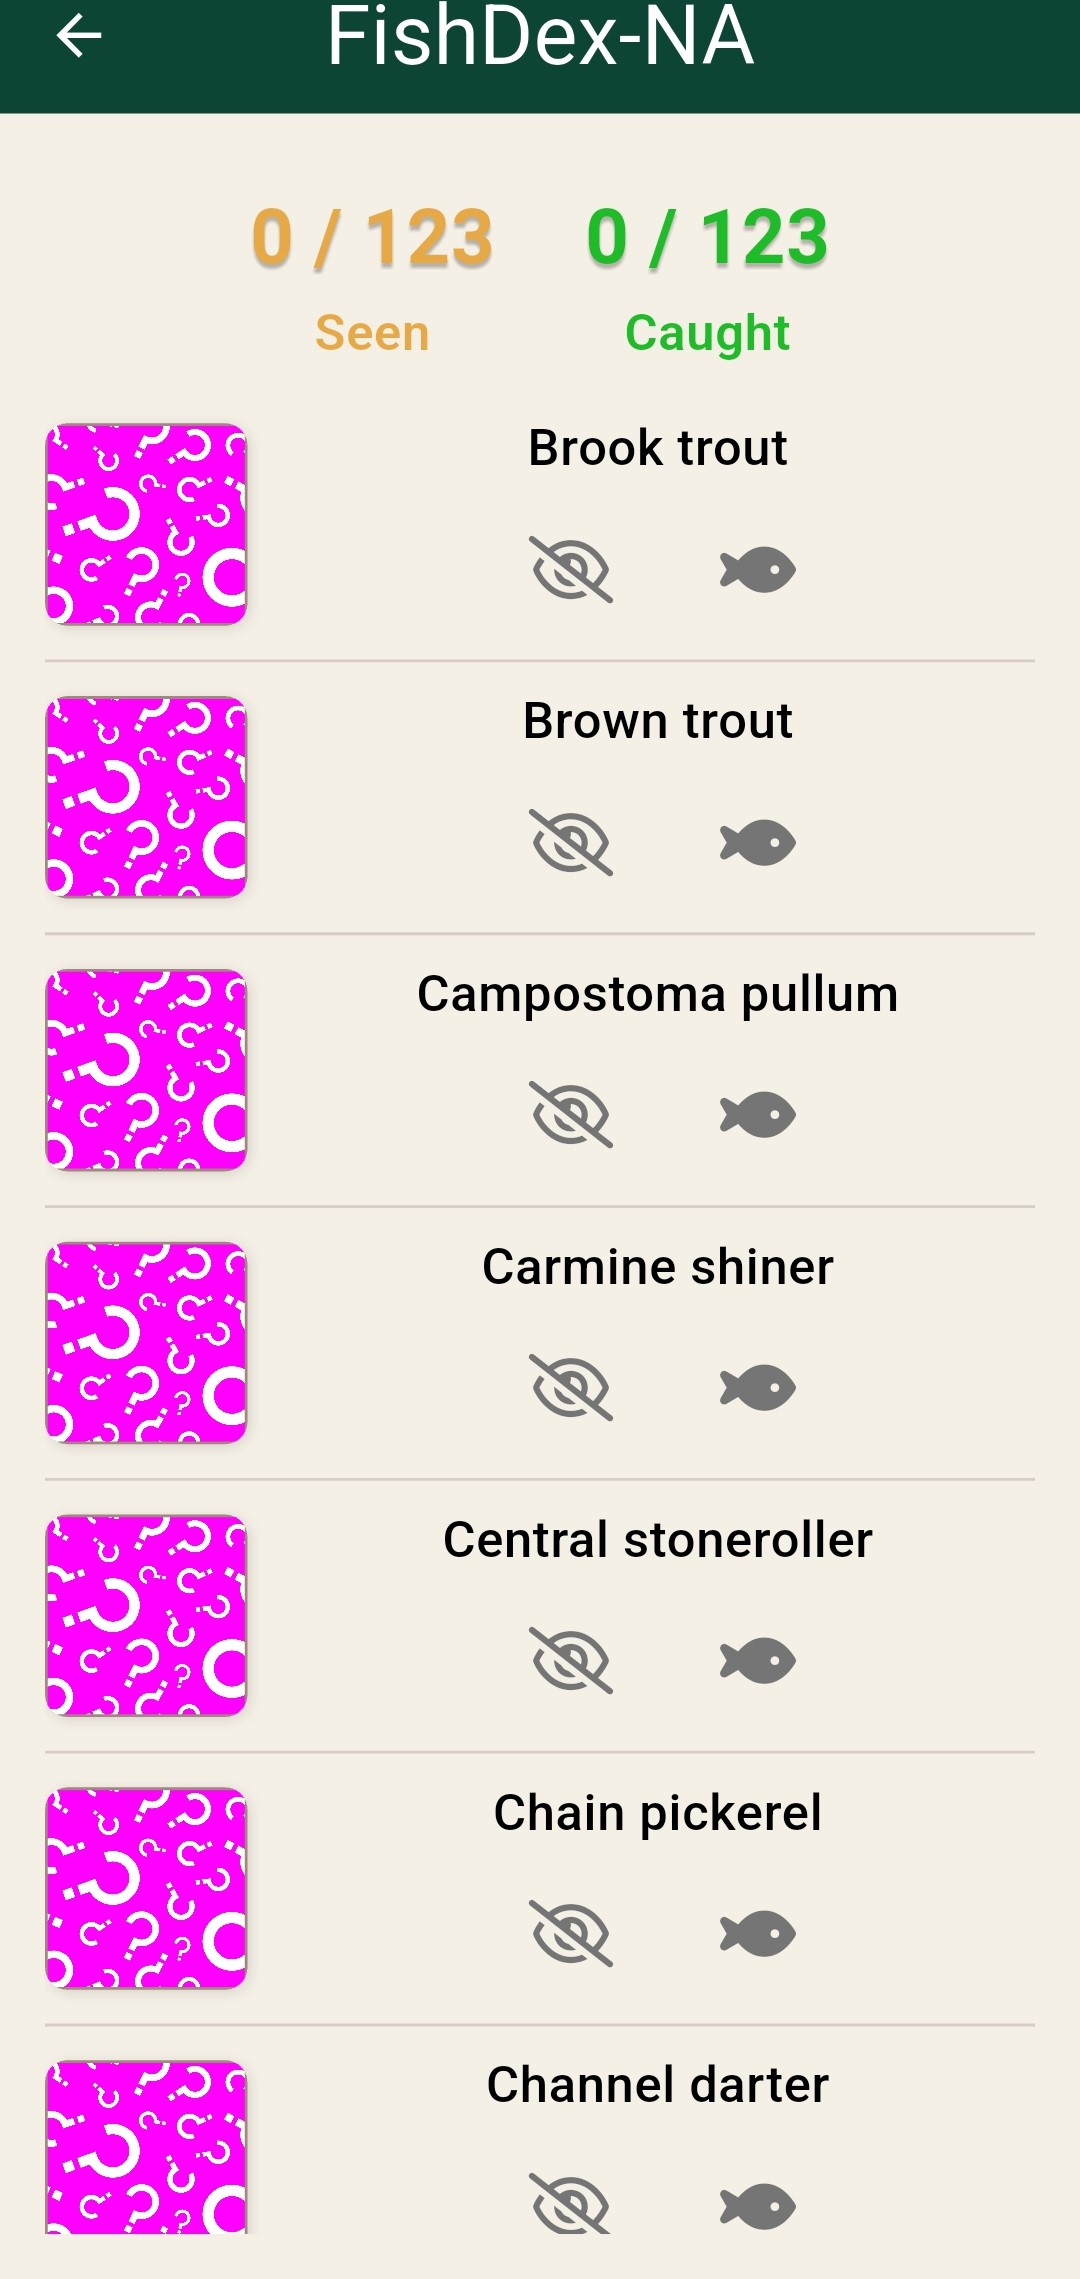
Fisherman’s Journey is a mobile app that lets users keep a personal record of the fish they catch. Each catch becomes a collectible-style digital card storing detailed information about the fish and the experience.
In the “Add Fish” interface, users create a card for each catch. The front lets them assign attributes like strength, agility, energy, and intellect, giving each fish a unique profile, while also recording the location and personal notes.
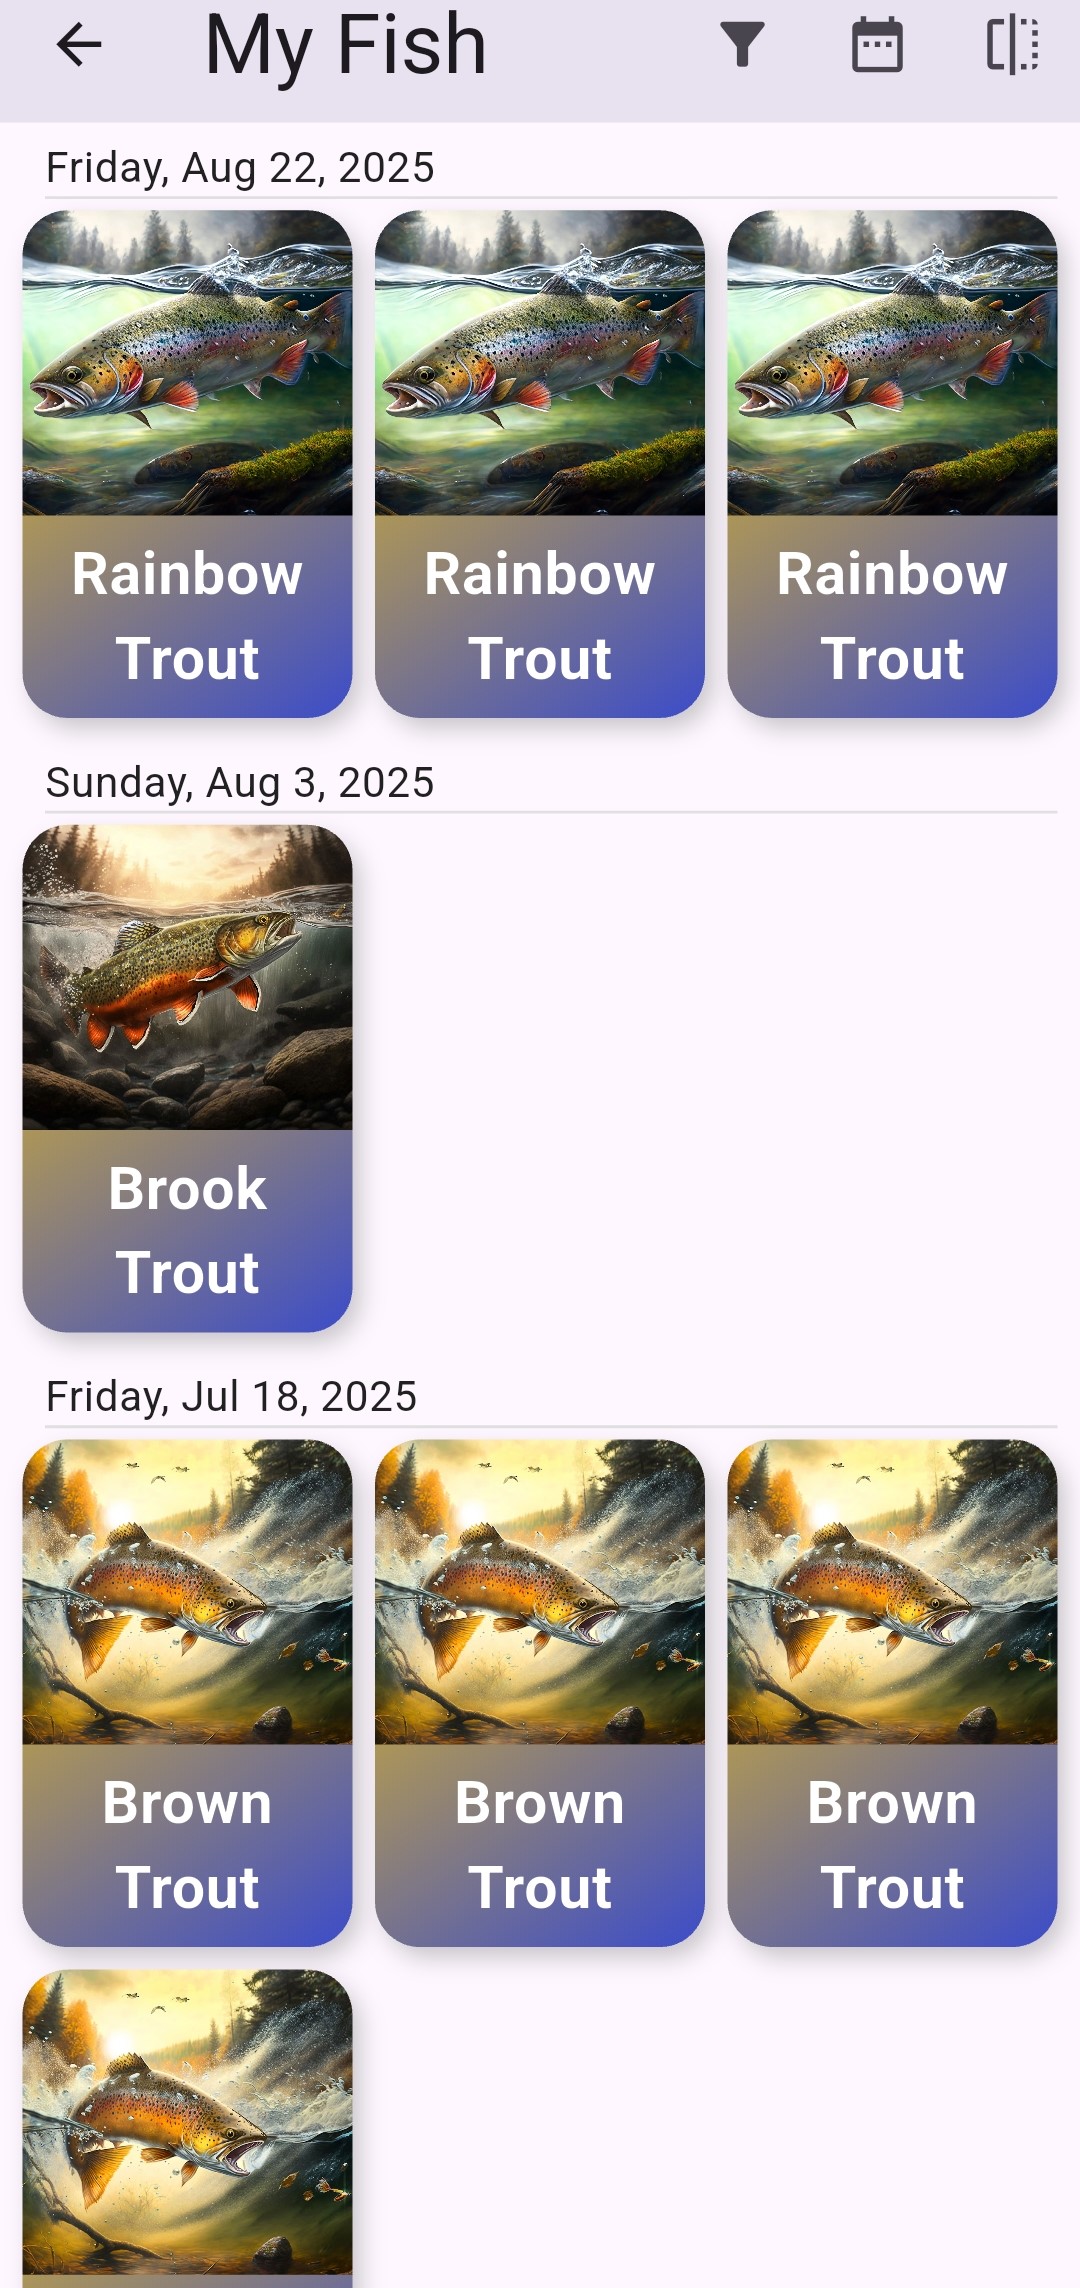
The back of the card allows users to upload a custom image of their catch, making each entry personal and visually tied to the real experience. Saved fish are added to the “My Fish” collection, automatically sorted by date caught for easy tracking over time.
Built with Flutter for cross-platform development, Firebase for backend services, and Android Studio, the app demonstrates my ability to design intuitive interfaces, structure dynamic data, and connect frontend and backend systems into a functional, user-focused mobile application.